Project Overview
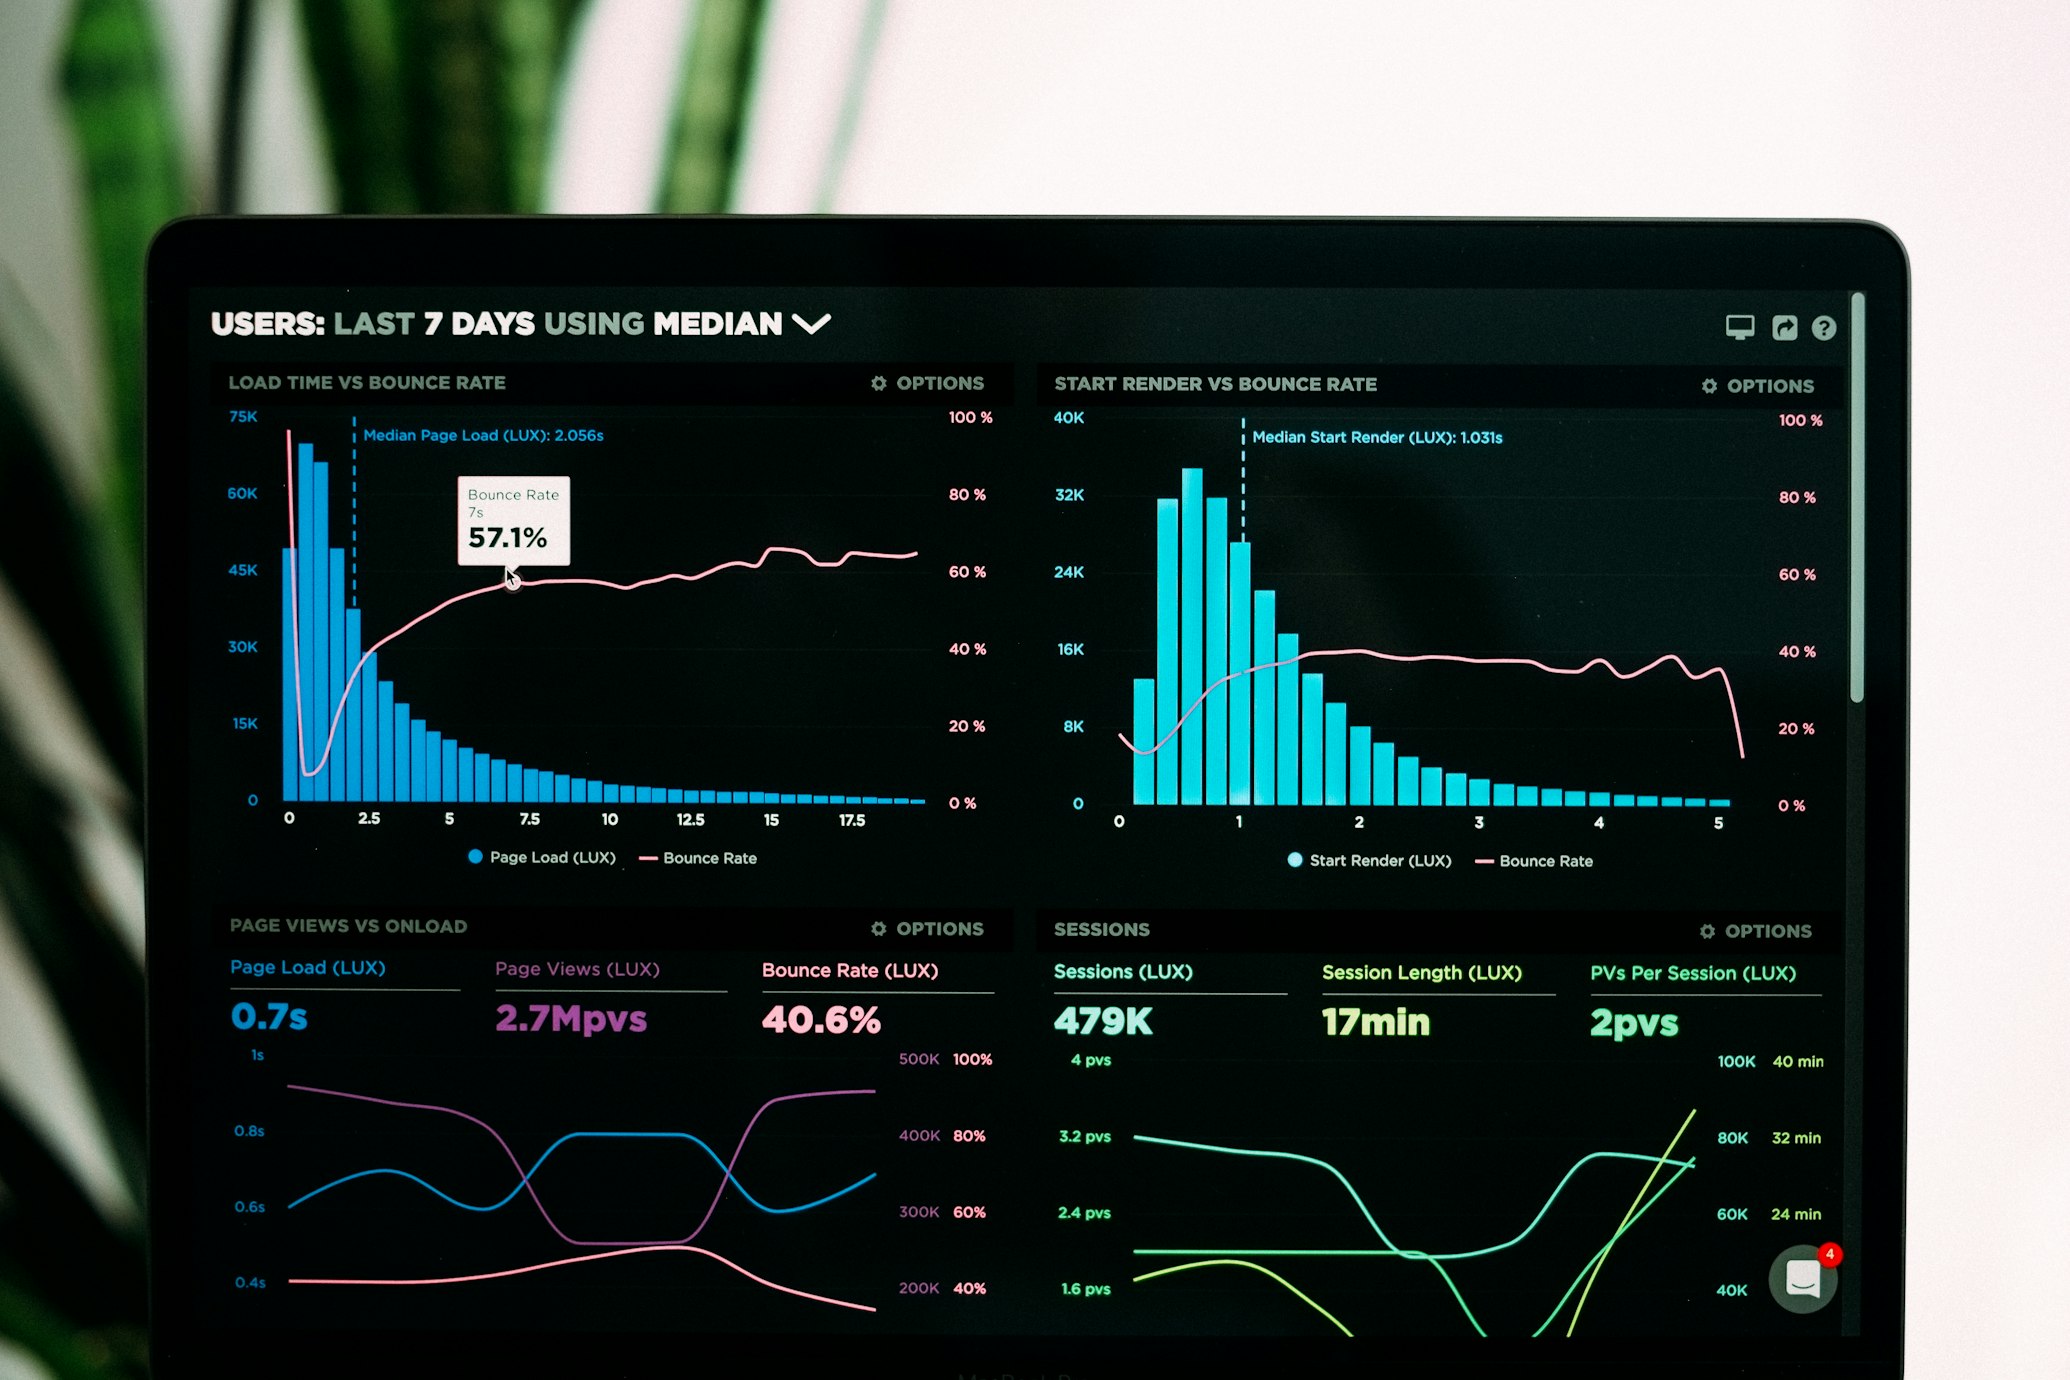
Developed a modern, real-time analytics dashboard that provides interactive data visualization and analysis tools for business metrics. The application features real-time updates, customizable widgets, and responsive design.
Key Features
- Real-time data visualization with WebSocket integration
- Interactive charts and graphs using D3.js
- Customizable dashboard layouts with drag-and-drop
- Advanced filtering and data analysis tools
- Dark/light theme support
- Export capabilities for reports
Technical Implementation
- Built with React 18 and TypeScript
- Implemented real-time updates using WebSocket
- Created reusable chart components with D3.js
- Used Material-UI for consistent design
- Implemented Redux for state management
- Optimized performance with React.memo and useMemo
Architecture Highlights
- Component-based architecture for reusability
- Custom hooks for data fetching and WebSocket
- Modular chart components with TypeScript
- Responsive design using CSS Grid and Flexbox
- Efficient state management with Redux Toolkit
Impact
- Reduced dashboard loading time by 60%
- Improved user engagement by 40%
- Enabled real-time decision making
- Increased data accessibility across teams
